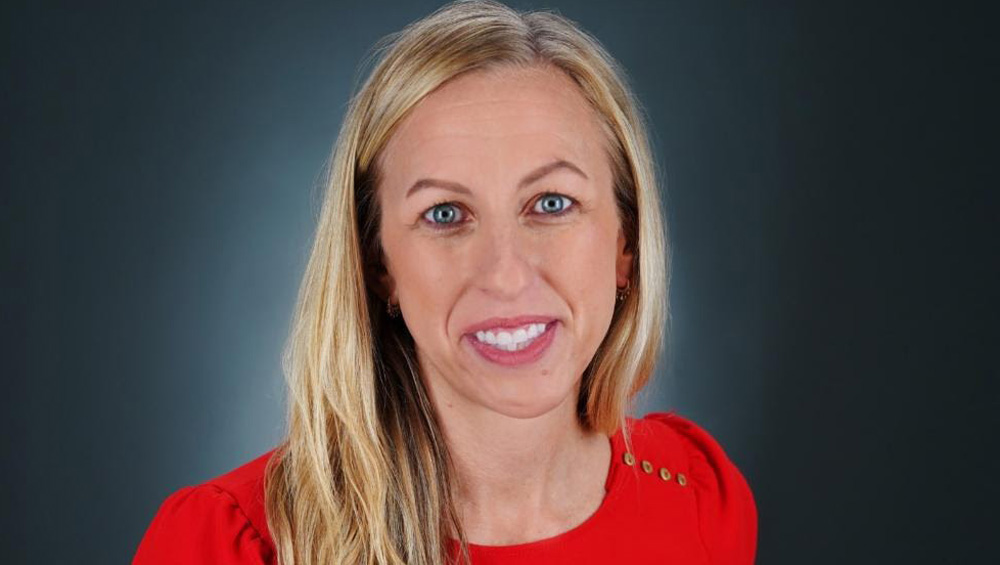
Advocating for her press corps colleagues has become a second full-time job for NBC News' senior White House correspondent.

Advocating for her press corps colleagues has become a second full-time job for NBC News' senior White House correspondent.
The new deal includes Tegna stations in Seattle, Portland and Spokane and streaming on Prime Video across Washington, Oregon and Alaska.
The assistant news director at WXIA Atlanta will be recognized at RTDNA24 in Milwaukee, June 12-14.

Last week’s NAB Show thrummed with broadcasters keen to arm themselves for a rocky 2025.
Comcast reported first quarter results that outpaced Wall Street expectations, with Peacock reaching 34 million subscribers but posting higher programming costs. Total revenue inched up 1% to $30.1 billion, with adjusted earnings per share coming in at $1.04, up from 92 cents in the year-ago period. The Media division, which includes Peacock, reported a nearly 4% gain in revenue, to $6.4 billion. But higher operating expenses, notably higher programming expenses at Peacock, contributed to wider losses. Adjusted EBITDA, a key measure of profitability, fell 6% to $827 million.
Meta Platforms earned $12.37 billion, or $4.71 per share, in the January-March period. That's up from $5.71 billion, or $2.20 per share, in the same period a year earlier. Revenue rose 27% to $36.46 billion from $28.65 billion. Analysts, on average, were expecting earnings of $4.32 per share on revenue of $36.14 billion, according to a poll by FactSet.
Continued investment in streaming contributed to a first-quarter loss for Spanish-language media giant TelevisaUnivision, which is seeing the bulk of its growth come from its Mexican operations while U.S. revenue stays flat with year-earlier results. Revenue during the quarter improved 7%, to $1.1 billion. Revenue from Mexican operations rose 23%, to $409 million. But revenue from U.S. businesses — a bigger part of the company’s overall financial results — stayed flat at $740 million, despite a first-quarter airing of a Spanish-only version of the 2024 Super Bowl on Univision.
Conditions put on the proposed sale of WADL Detroit to Mission Broadcasting have created a potential drama in the Motor City. Kevin Adell, CEO of Adell Broadcasting, owner of WADL, said he expects the $75 million deal to go through, but said that Mission called the conditions “problematic.” Mission’s bid is being financed by Nexstar Media Group, which wants WADL to become the market’s CW affiliate after Sept. 1, when the CW’s deal with WMYD, owned by E.W. Scripps, expires. Scripps and Nexstar have said the affiliation deal won’t be renewed.

David Buonfiglio: "I love TV. Always have. I’m still convinced it’s the single most effective branding medium ever created. I worked in (or for) local broadcast TV for 35 years. Briefly in news, but almost entirely in sales. That ended last year. And now that I have some distance and time between me and the medium I’ve loved for so long, I realize a couple a stark and unnerving truths about the business of local TV."

The actor’s April 13 episode, which also featured musical guest Chris Stapleton, drew 8.9 million viewers after seven days, according to NBCUniversal. In the 18-49 demo, the episode is up to a 2.0 rating. That’s the show’s largest seven-day audience since Billie Eilish hosted in December 2021, and it’s the best demo performance since Dave Chappelle’s last hosting gig in November 2022.

The parent company for The Enquirer, the tabloid now famous for its ties to former President Donald Trump, has tried repeatedly to sell the publication. It hasn’t been easy. (Mary Altaffer/AP)

Jobs posted to TVNewsCheck’s Media Job Center include an opening for a director of sales and an account executive, executive producer, meteorologist, weekend anchor, sales manager, senior newscast producer, digital video producer and reporter.

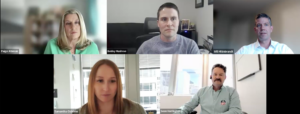
Streaming sales leaders from Gray Television, E.W. Scripps, Hearst Television, Ticker and Megaphone TV will share the latest developments in technology and strategy for OTT and FAST channels. Learn more about this critically important revenue source for broadcasters in a TVNewsCheck Working Lunch Webinar on May 16. Register here.
16 May 2024
23 May 2024